

Being able to gauge the strength of a support/resistance level is a basic necessity for successfully predicting price movements. Candlestick Forex analysis can be a powerful tool if used correctly. This lesson shows how a trader can view certain support and resistance indicators or signals with an understanding of why the price is likely to move in a certain direction. Patterns on a candlestick chart will indicate specific price levels at which a currency pair should be sold or bought.
ADDITIONAL READING ABOUT CANDLE ANATOMY AND MEANING
There are several patterns that are used on candlestick charts:
A candlestick hammer is a price pattern in candlestick charting that occurs when a security trades significantly lower than its opening, but rallies later in the day to close either above or close to its opening price. A candlestick hammer occurs after a security has been declining, possibly suggesting the market is attempting to determine a bottom. The signal does not mean bullish investors have taken full control of a security, it simply indicates that the bulls are strengthening.
Another pattern is the candlestick Doji. The Doji is a powerful candlestick formation, signifying indecision between bulls and bears. A Doji is quite often found at the bottom and top of trends and thus is considered as a sign of possible reversal of price direction, but the Doji can be viewed as a continuation pattern as well. A Doji is formed when the opening price and the closing price are equal.
When a security's price, at some point during the day, advances well above the opening price but closes lower than the opening price this is placed on the candlestick chart as a candlestick shooting star. The candlestick formation must be on an upward or bullish trend, and the distance between the highest price for the day and the opening price must be more than twice as large as the shooting star's body. In addition, the distance between the lowest price for the day and the closing price must be very small or nonexistent
CANDLESTICK FOREX ANALYSIS
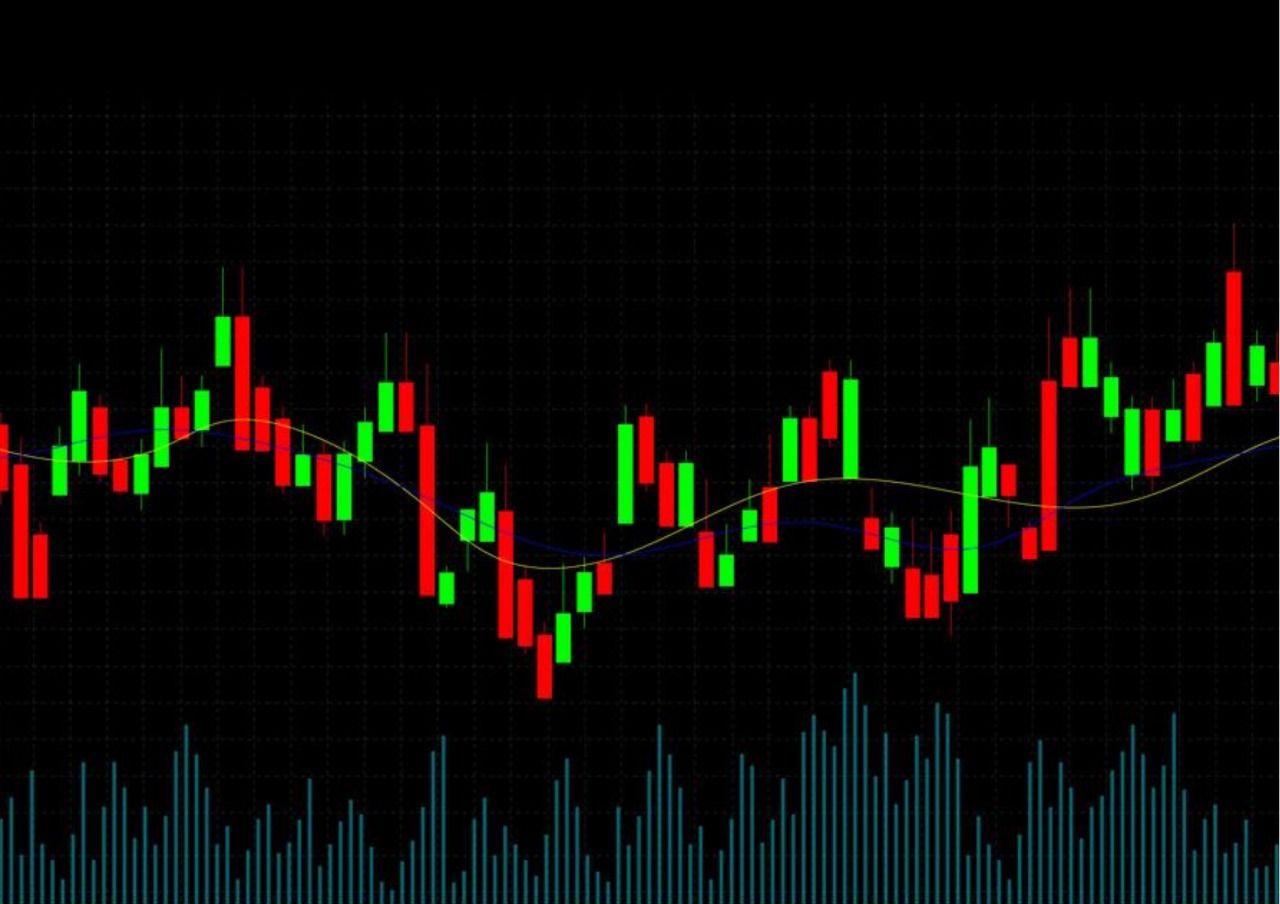
Charts come in different styles, but we will focus on Japanese candlestick or candle charts, which have become by far the most popular because they provide the quickest visual grasp of price action and the market sentiment behind it.

key points to understand about candlestick charts:
Candles usually have a body and wick (also called a shadow) at both ends. The body represents the range between the open and closing price for a given period. The wicks, or shadows, show the upper and lower price ranges. Any of these individual parts may be missing from a given candle.
Each candle displays all price information: the high, low, and open and closing prices for a given period, depending on the chart’s time frame.
The period covered by each candle depends on the time frame of the chart.
- Each candle on a one-minute candlestick chart covers the opening, closing, and high and low prices for one minute.
- Each candle on a daily candlestick chart shows this price information for an entire day.
Body color tells us the price direction for the given period. The most common color coding is green bodies for higher closes and red for lower ones. In this course series, we will continue to use green for higher closes and red for lower ones. Relationship between the Body and the Wick is The length of the bodies and the wicks, in absolute terms and relative to each other, can tell us a great deal about market sentiment over the duration of any given candle in a candlestick chart.


03 Comments
“i enjoyed coming to online trading academy because it thought me the right things to do regarding trading”
“David brings a new perspective that makes Core Strategy easier to execute. How come the other FX teachers don't do this?? You can use my name: Aaron Yoon ”
“Very hands on instructor in using the Oanda platform. Was a great help to me personally”